Australian Property Data Collection and Consolidation

“This project combines key Australian datasets—including housing prices, rental values, school information, transport accessibility, and crime statistics—to generate actionable insights into the livability of different areas.”
Tools used:
For Data Consolidation (SSIS)[Visual Studio]
For Data Formatting and cleaning (Power Query Editor)
For Data Visualization (PowerBI)
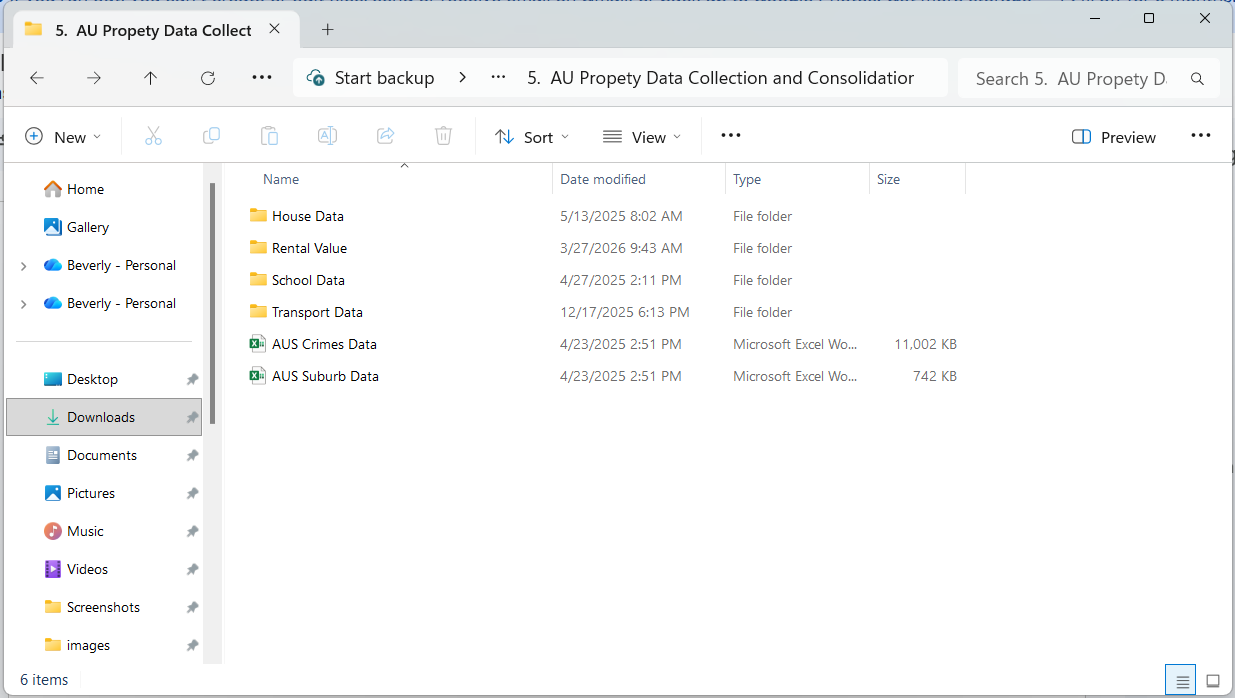
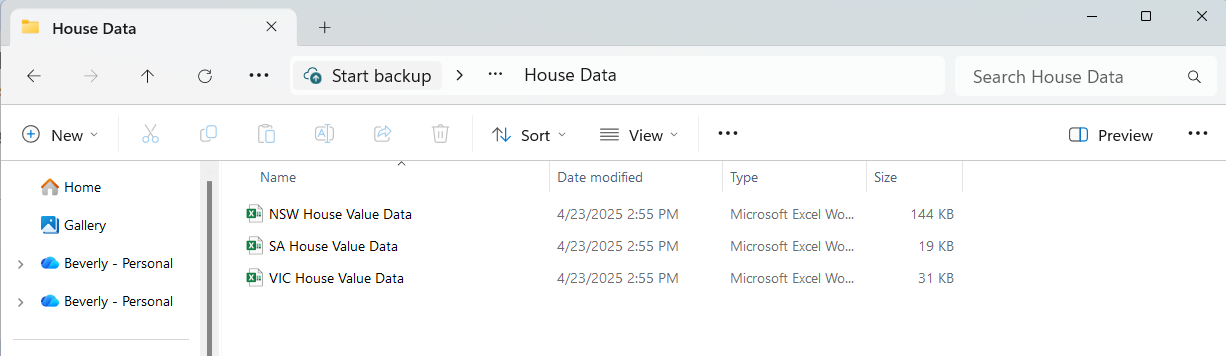
To start with, we see the data are spread to multiple excel files from different source file for each state, it requires data to be cleansed and unified.
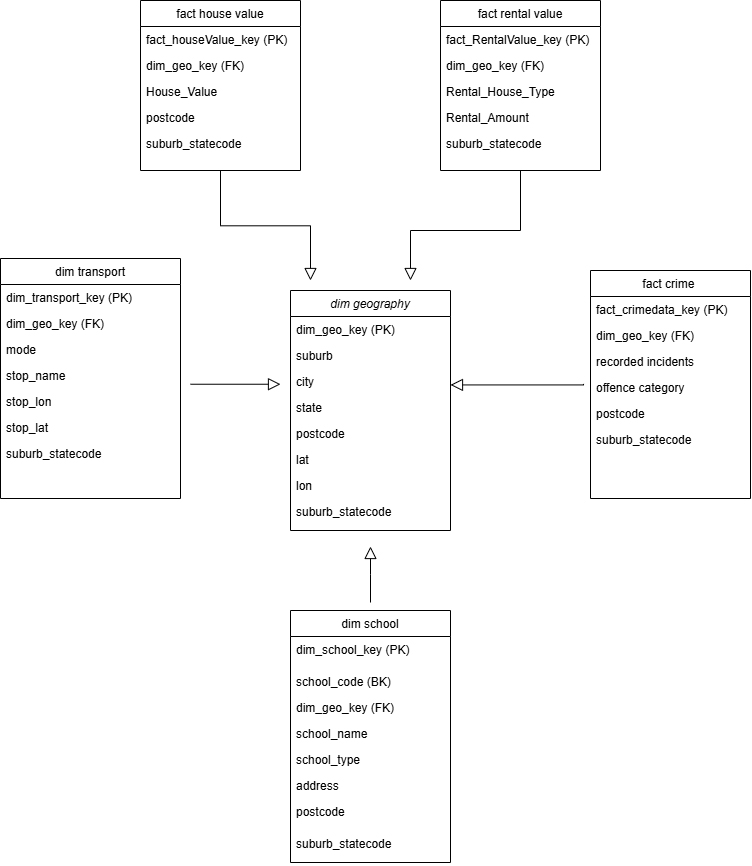
I design a one level data modelling approach (Star Schema), provides a streamlined structure, allowing for more efficient mapping of foreign keys and business keys across dimension (dim) and fact tables.
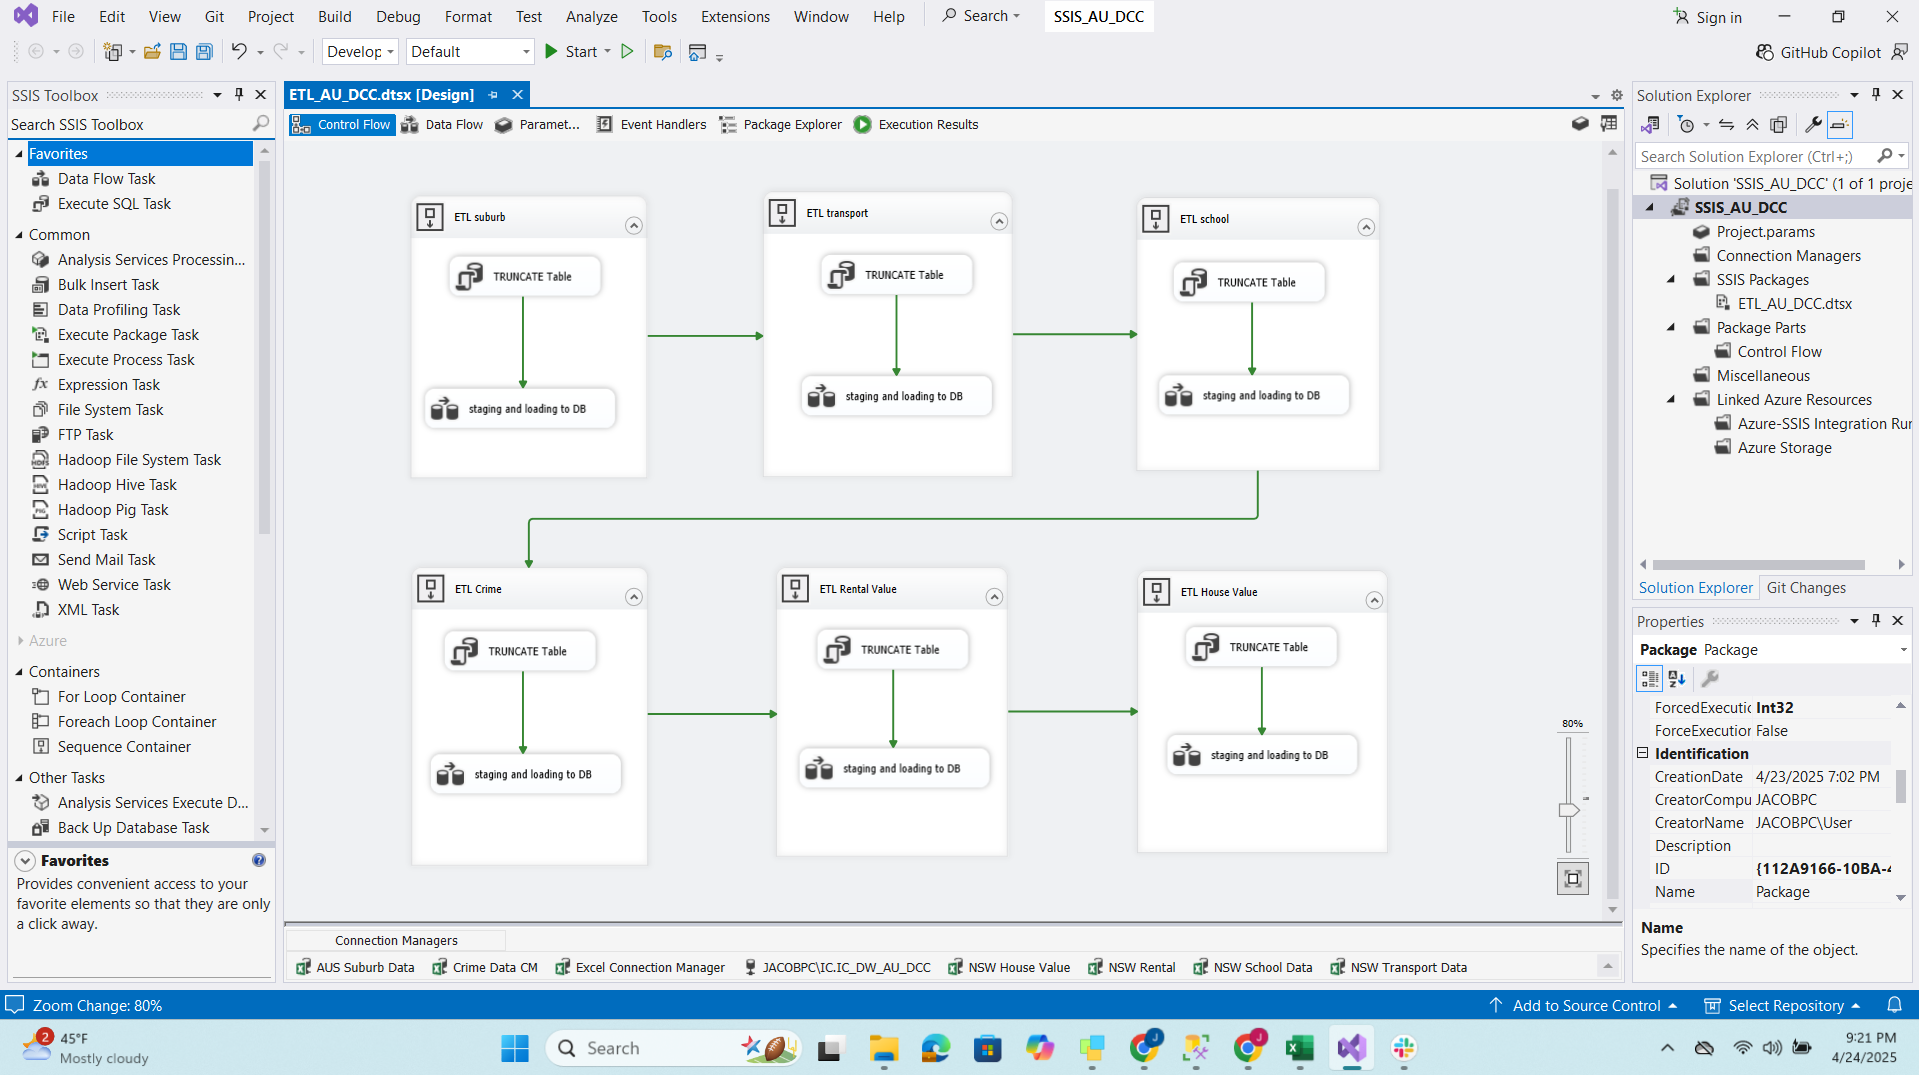
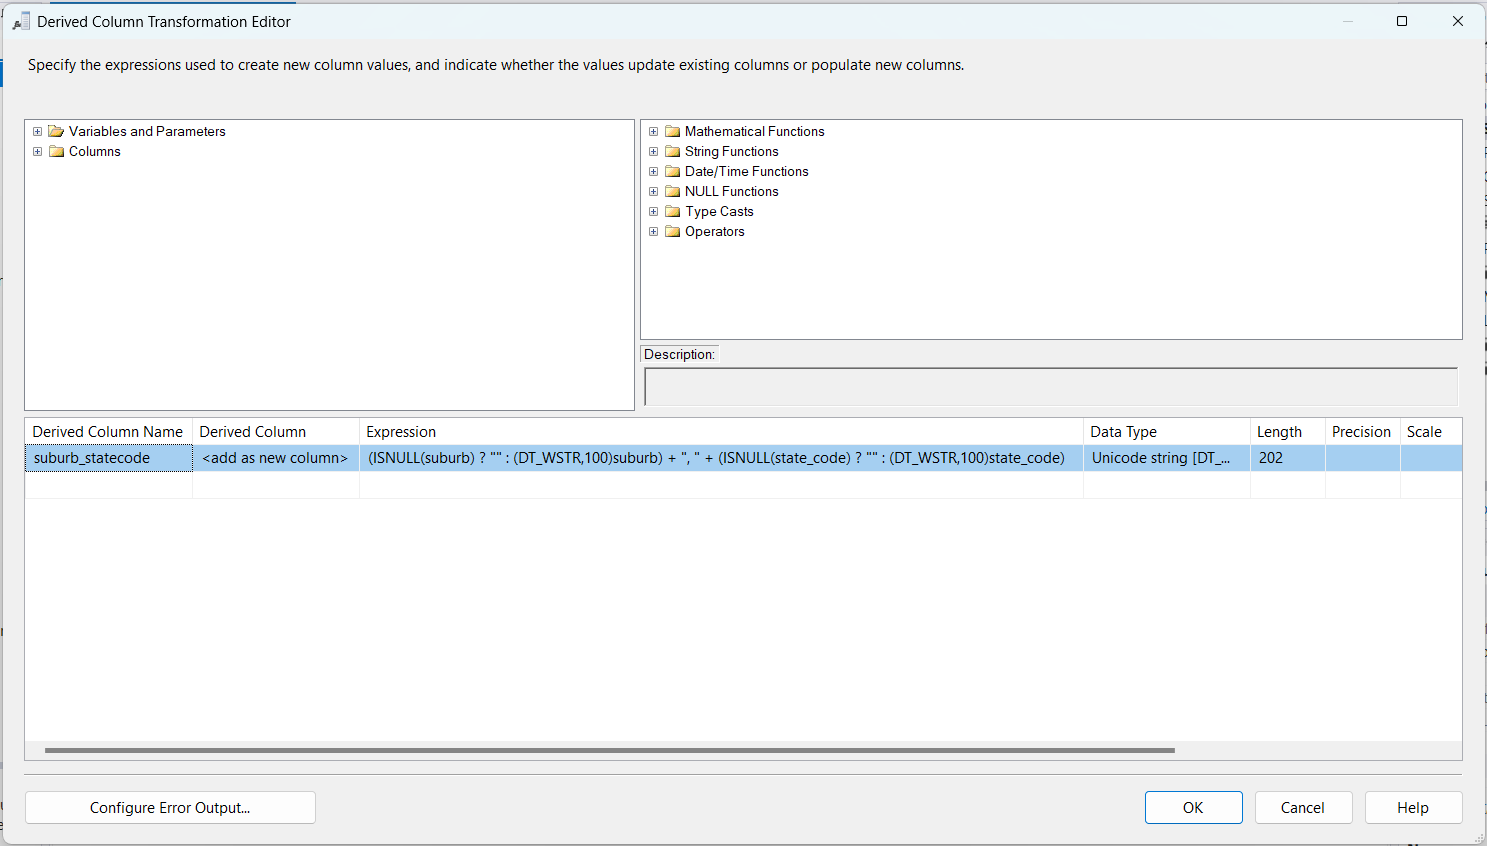
In this project, I built an SSIS package in Visual Studio to extract, transform, and consolidate multiple Excel file tables into categorized SQL database tables before loading them into the data warehouse.
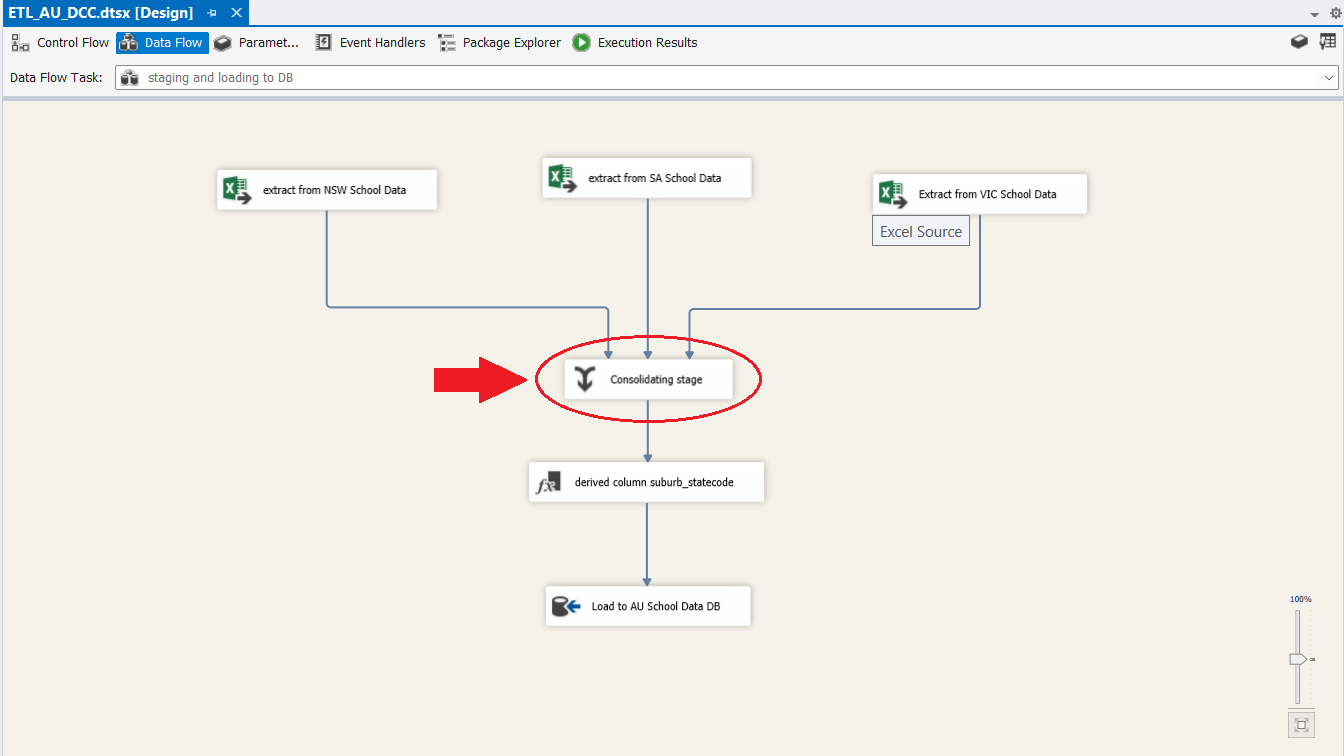
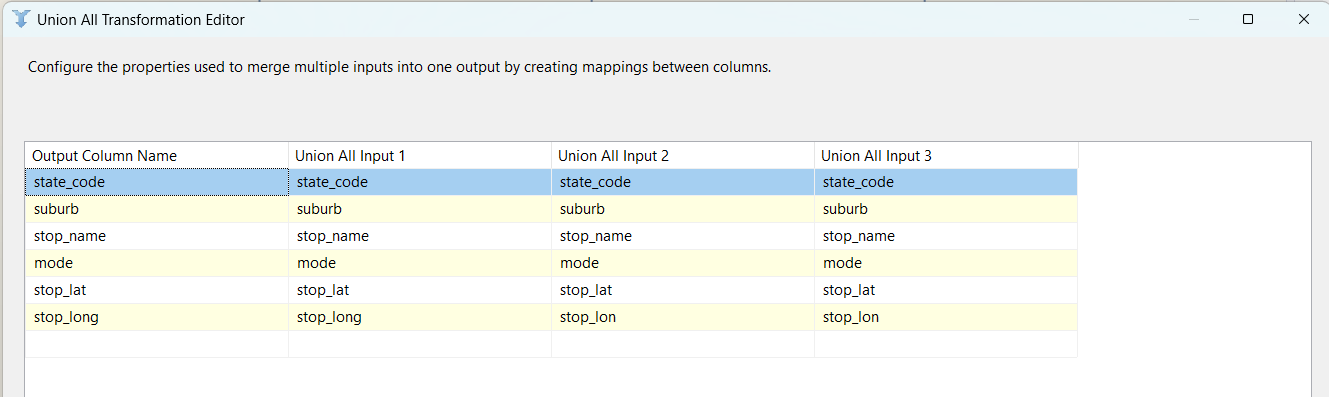
During staging, I used the UNION ALL SSIS Task to merge data before finalizing the load into dimension and fact tables
Now it was successfully loaded in our Datawarehouse
Now we are able to connect our Datawarehouse to Power BI for cleaning and Visualization
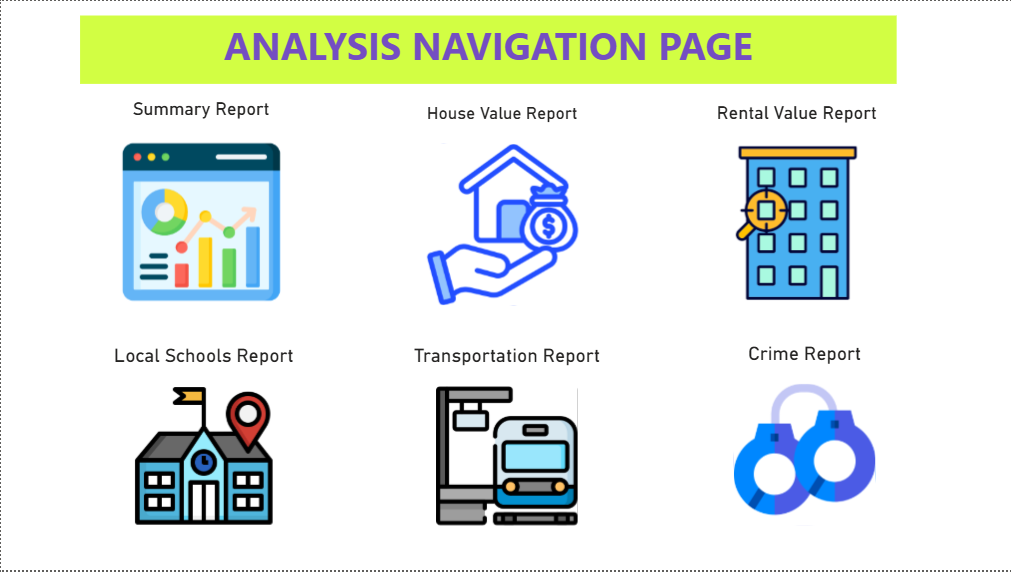
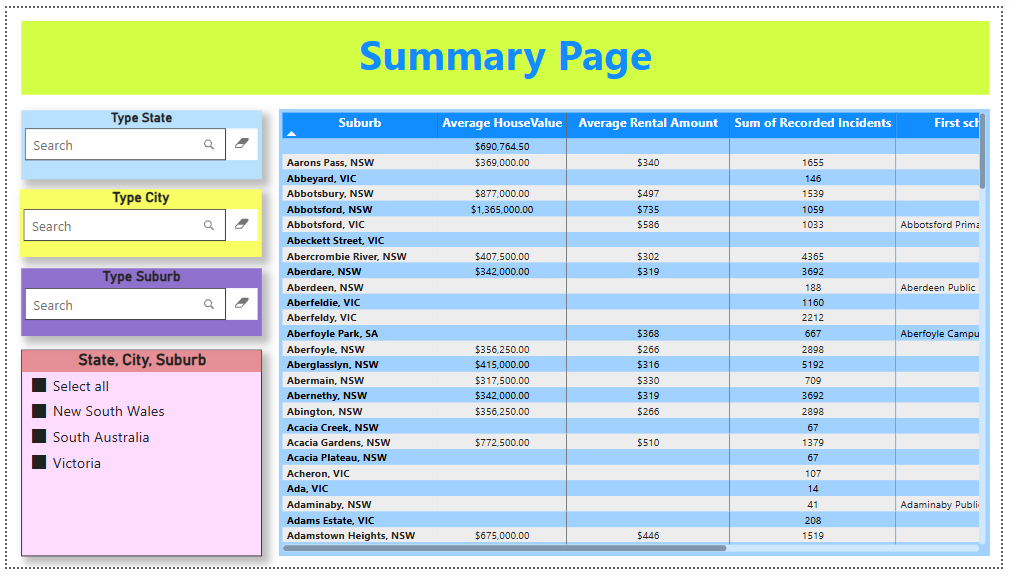
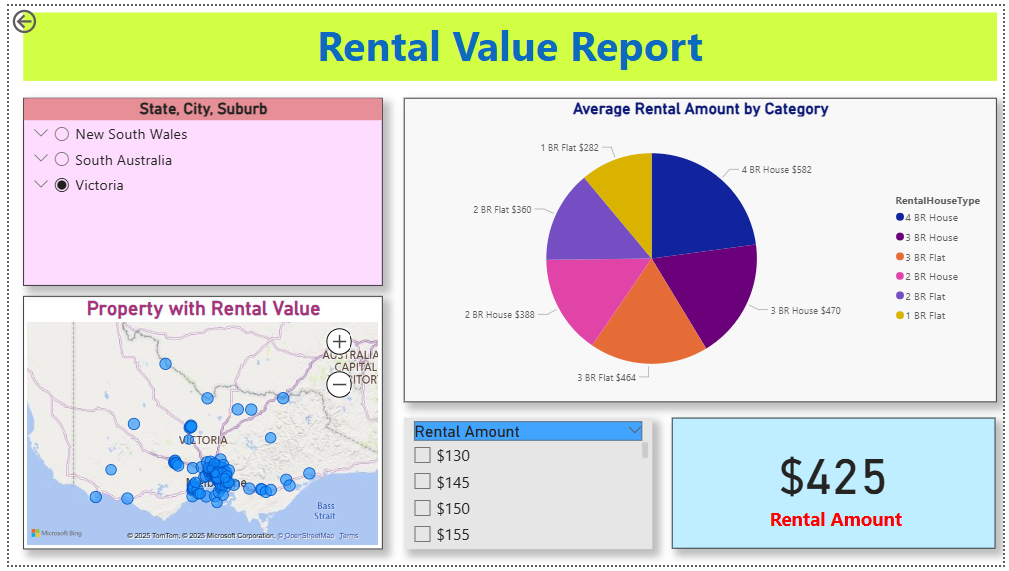
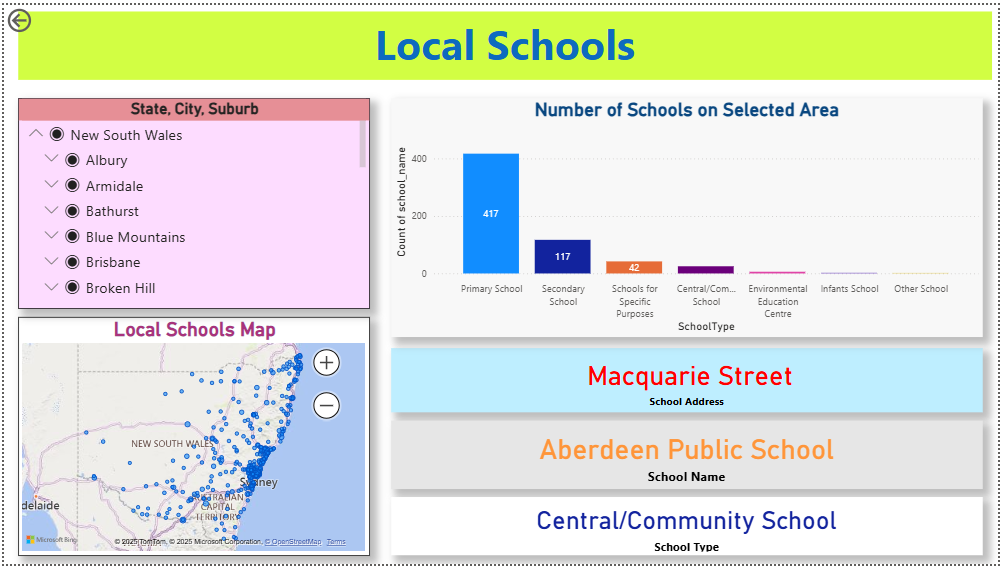
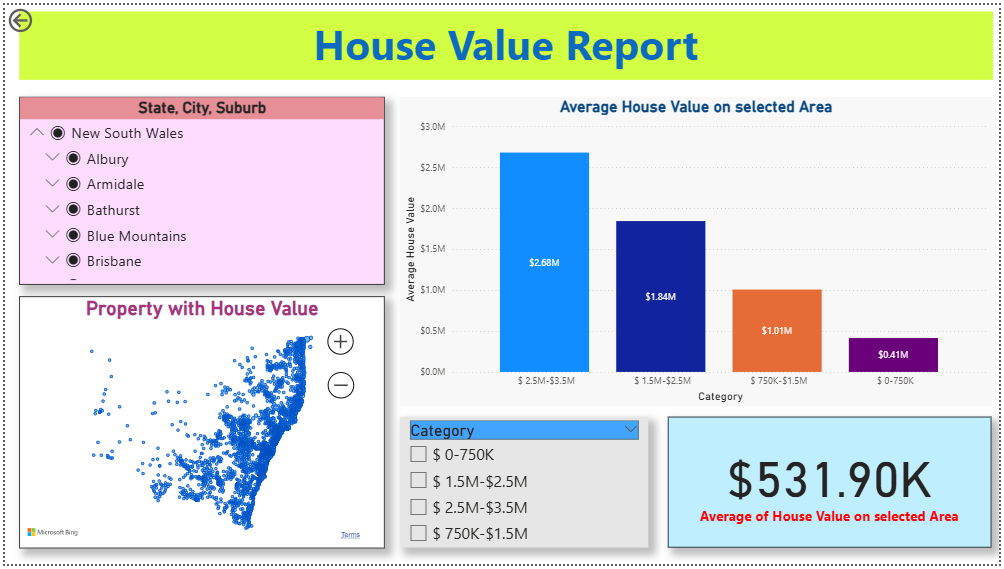
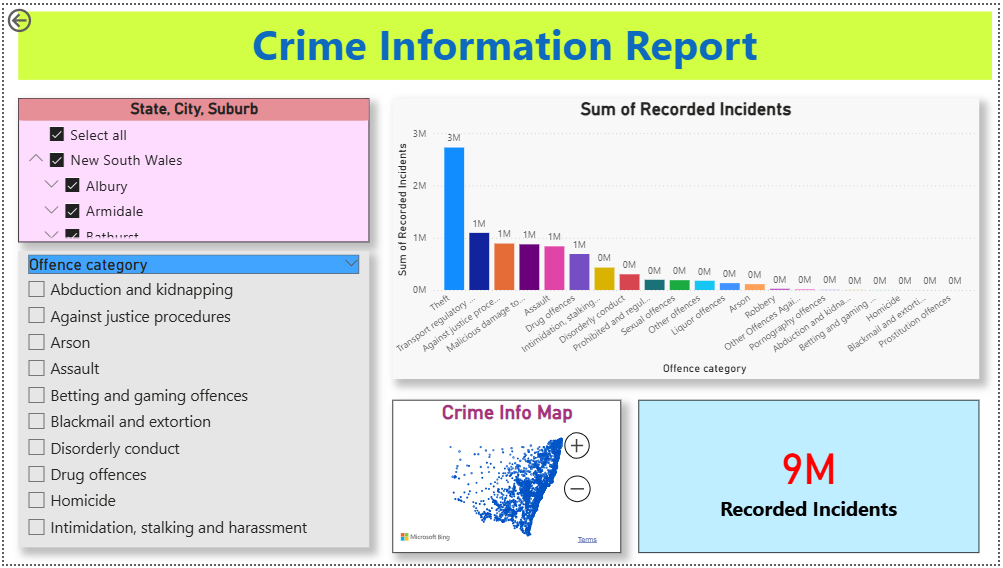
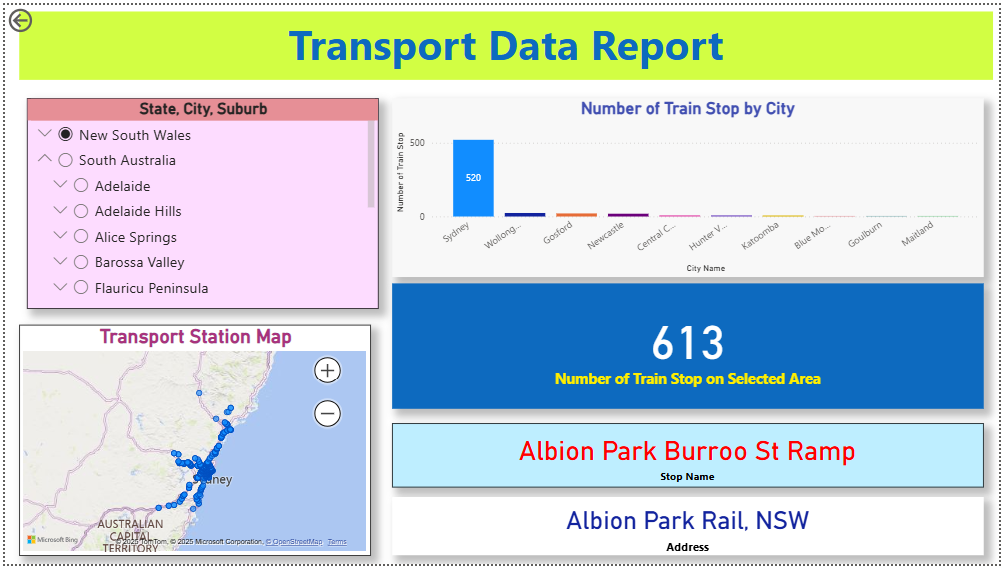
I employ a streamlined visualization approach in Power BI to effectively highlight key insights. A simple yet informative chart presents the most relevant data categories, including Rental, House, School Category, and Crime Category, ensuring a quick and comprehensive overview.
Additionally, an interactive map is utilized for precise location identification, providing geographic context to the analysis. To further enhance clarity, I incorporate Cards to dynamically display selected data, allowing users to focus on specific metrics with ease.